ESG
Performance
Highlights of Prysmian’s ESG performance during 2024 are provided below.
Governance
Governance: Ethics and integrity
The central role played by sustainability in Prysmian's strategy is also evident from the definition of a specific type of governance, which is responsible for overseeing all Group initiatives in a structured and rigorous manner and ensuring their alignment with ESG targets.
Topics

SDG's

Goals: 2023-2025 Prysmian Scorecard
 | S1-Own Operations | Percentage of employee shareholders1 | 37% | 46% | 46% | 44%/45% |
|
| G1-Corporate conduct | Percentage of completion of e-training on ethics and integrity issues2 | 75% | 89.31% | 90% | 90% |
1 Number of employees with Prysmian shares deposited in company administrative accounts through GROW, YES and BE IN plans as at 31 December, divided by the total number of employees eligible to participate in at least one of the plans. The number refers to Prysmian only in 2024; Encore Wire employees are not included in the calculation because they are not "eligible".
2 It includes e-learning conducted through the Group's business management system and is for all desk workers (excluding business partners, consultants, contractors, employees on leave of 30 days or more and temporary trainees). It is subject to annual approval of the compliance plan by the Board of Directors; topics may include one or more of the following: code of ethics, anti-corruption, gifts, conflicts of interest, Helpline or business policy. The number refers to Prysmian only, as it does not apply to Encore Wire for the year 2024.
2 It includes e-learning conducted through the Group's business management system and is for all desk workers (excluding business partners, consultants, contractors, employees on leave of 30 days or more and temporary trainees). It is subject to annual approval of the compliance plan by the Board of Directors; topics may include one or more of the following: code of ethics, anti-corruption, gifts, conflicts of interest, Helpline or business policy. The number refers to Prysmian only, as it does not apply to Encore Wire for the year 2024.
2024 Performance
Ethics and integrity
| Communication of the organization's anti-corruption policies and procedures | Number | Percentage of total |
|---|---|---|
| Members of the Prysmian S.p.A, BoD | 12 | 100% |
| Employees*: | 15,375 | - |
| of which white collar | 8,450 | 96% |
| of which blue collar | 4,218 | 96% |
| of which interns | 488 | 96% |
| of which external | 2,219 | 96% |
*Percentages based on intended recipients
Tax reporting, country by country (€ million)
| 2024 | Revenue Related Parties | Revenue unrelat-ed par-ties | Total Revenues | Profit and Loss before tax | Corporate income tax paid on cash basis | Corporate income tax accrued | Number of employees (FTE) | Tangible Assets | Employee Remuneration |
|---|---|---|---|---|---|---|---|---|---|
| Nord America | 1,245 | 6,175 | 7,420 | 496 | 122 | 98 | 7,752 | 2,854 | 651 |
| Canada | 434 | 551 | 985 | 58 | 20 | 19 | 728 | 121 | 56 |
| Stati Uniti | 785 | 5,483 | 6,268 | 446 | 102 | 82 | 7,025 | 2,714 | 581 |
| Automotive | 26 | 141 | 167 | (8) | 0 | (3) | - | 19 | 14 |
| LATAM | 412 | 1,602 | 2,014 | 164 | 30 | 46 | 5,214 | 488 | 108 |
| Brasile | 135 | 693 | 828 | 63 | 4 | 16 | 1,950 | 211 | 54 |
| Altro | 277 | 909 | 1,186 | 101 | 26 | 29 | 3,265 | 277 | 54 |
| EMEA | 6,695 | 9,438 | 16,132 | 227 | 94 | 113 | 17,083 | 3,991 | 1,040 |
| Francia | 694 | 792 | 1,486 | 6 | 5 | 1 | 2,544 | 590 | 196 |
| Germania | 504 | 1,194 | 1,699 | 35 | 2 | 4 | 1,956 | 403 | 168 |
| Italia | 3,326 | 3,037 | 6,363 | (165) | 24 | 19 | 2,901 | 403 | 168 |
| Olanda | 244 | 549 | 794 | 93 | 1 | 32 | 946 | 190 | 80 |
| Spagna | 385 | 886 | 1,270 | 52 | 13 | 8 | 1,212 | 269 | 77 |
| Regno Unito | 156 | 519 | 675 | 20 | 4 | 3 | 1,046 | 233 | 69 |
| Altre | 1,386 | 2,461 | 3,846 | 186 | 45 | 45 | 6,478 | 1,020 | 206 |
| APAC | 485 | 1,070 | 1,555 | 49 | 15 | 20 | 3,112 | 325 | 102 |
| Cina | 340 | 339 | 679 | 28 | 8 | 10 | 1,545 | 124 | 41 |
| Altro | 145 | 731 | 876 | 21 | 7 | 10 | 1,567 | 201 | 61 |
| Totale | 8,837 | 18,284 | 27,121 | 937 | 261 | 277 | 33,161 | 7,658 | 1,902 |
Cybersecurity
| Description | Unit of measurement | 2024 | 2023 |
|---|---|---|---|
| Information Security training courses | Number | 27 | 18 |
| Average time for high-risk vulnerability resolution | Weeks | 13 | 15 |
| Log sources integrated with SIEM solution | Percentage | 89% | 89% |
| Security incidents | Number | 1,286 | 707 |
| Cyber-attacks on total security incidents | Percentage | 2% | 3% |
| Average time for forensic activities after an incident | Hours | 4 | 4 |
Environment
Environmental Responsibility
Prysmian is committed to reducing the negative impact on the environment during its manufacturing and installation activities and acts directly on the design and configuration of its products and solutions, helping to facilitate decarbonization along its value chain. Prysmian holds a leadership role in its supply chain by promoting virtuous practices with all its partners.
Topics
SDG's
Goals: 2023-2025 Prysmian Scorecard
 | E1-Climate change | Percentage reduction in GHG emissions Scope 1 and 2 Market-Based vs baseline 20191 | -28% | -33% | -37% | -38%/-40% |
|
| Percentage reduction in Scope 3 emis-sions vs Baseline 20192 | -7,5% | -10% | -21% | -11.5%/-15% |
1 Reduction in CO2 emissions (Scope 1 and 2) compared to 2019, according to SBTi methodology. Scope 2 is calculated using the Market-based method. The figure refers to Baseline 2019 equaling 920 kton CO2, and does not include Encore Wire emissions as the company is waiting for approval of the baseline restatement by SBTi.
2 Reduction in CO2 emissions from the entire value chain (Scope 3) compared to 2019, according to the SBTi methodology. The figure does not include Encore Wire emissions as the company is waiting for approval of the baseline restatement by SBTi.
2 Reduction in CO2 emissions from the entire value chain (Scope 3) compared to 2019, according to the SBTi methodology. The figure does not include Encore Wire emissions as the company is waiting for approval of the baseline restatement by SBTi.
2024 Performance
Energy consumed (MWh) (*)
| Energy consumption and mix (37., AR 34.) - high impact MWh | Total 2024 previ-ous Prysmian scope | Total 2024 Prysmian | Total 2023 |
|---|---|---|---|
| 38. (a) Fuel consumption from coal and coal products | - | - | |
| 38. (b) Fuel consumption from crude oil and petroleum products | 275,469 | 275,479 | 294,669 |
| 38. (c) Fuel consumption from natural gas | 619,459 | 717,344 | 632,604 |
| 38. (d) Fuel consumption from other non-renewable sources | - | - | - |
| 38. (e) Consumption of purchased or acquired electricity, heat, steam, and cooling from non-renewable sources | 1,137,729 | 1,214,607 | 1,121,666 |
| 37. (a) Total non-renewable energy consumption | 2,032,658 | 2,207,429 | 2,048,939 |
| AR 34. Share of non-renewable sources in total energy consumption | 78.34% | 79.71% | 76.59% |
| 37. (b) Consumption from nuclear products | 41,699 | 41,699 | - |
| AR 34. Share of consumption from nuclear products in total energy consumption | 1.61% | 1.51% | 0.00% |
| 37. (c) i. Fuel consumption for renewable sources (including biomass, biogas, nonfossil fuel waste, renewable hydrogen, etc.) | 1,038 | 1,038 | 244 |
| 37. (c) ii. Consumption of purchased or acquired electricity, heat, steam, and cooling from renewable sources | 506,423 | 506,423 | 626,124 |
| 37. (c) iii. The consumption of self-generated non-fuel renewable energy | 12,792 | 12,792 | - |
| 37. (c) Total renewable energy consumption | 520,253 | 520,253 | 626,368 |
| AR 34. Share of renewable sources in total energy consumption | 20.05% | 20.05% | 23.41% |
| 37. Total energy consumption | 2,594,610 | 2,769,381 | 2,675,307 |
(*) Energy consumed means the value expressed in Mwh of energy consumed within the organization, including both energy purchased from external sources and self-produced.
The 2023 and 2024 figures include estimates only for the Chiplun site.
The 2023 and 2024 figures include estimates only for the Chiplun site.
Emissions of tCO₂ (*)
| Gross Scopes 1, 2, 3 and Total GHG emissions (48., 49., 51., 52.) tCO2eq | Total 2024 Prysmian | Total 2024 Prysmian in-cluding Encore Wire | Total 2023 |
|---|---|---|---|
| Gross GHG emissions Scope 1 | |||
| 48. (a) Gross Scope 1 GHG emissions | 217,306 | 227,215 | 226,131 |
| 48. (b) Percentage of Scope 1 GHG emissions from regulated emissions trading systems | - | ||
| Scope 2 GHG emissions | |||
| 49. (a) Gross Scope 2 location based GHG emissions | 447,153 | 474,155 | 474,715 |
| 49. (b) Gross Scope 2 market based GHG emissions | 365,091 | 393,573 | 389,928 |
| 52. (a) Total Scope 1 and 2 (location based) GHG emissions | 664,460 | 701,370 | 474,715 |
| 52. (b) Total Scope 1 and 2 (market based) GHG emissions | 582,397 | 620,788 | 616,059 |
| Scope 3 GHG emissions | |||
| 51. Total gross indirect (Scope 3) GHG emissions | 235,598,561 | 239,303,832 | 267,433,725 |
| Purchased goods and services | 11,115,382 | 11,747,429 | 11,787,039 |
| Total GHG emissions (Scope 1, 2, 3) | |||
| Total GHG emissions | 236,180,958 | 239,924,620 | 268,049,784 |
| 52. (a) Total GHG emissions (location based) | 236,263,021 | 240,005,202 | 267,908,440 |
| 52. (b) Total GHG emissions (market based) | 236,180,958 | 239,924,620 | 268,049,784 |
(*) 2022 and 2023 GHG emissions were estimated only for Chiplun.
(1) Scope 1 Emissions comprise the direct emissions of the organization, being those generated from resources under its direct control. The reported Scope 1 emissions refer to combustion processes (using natural gas, LPG, petrol, diesel, fuel oil, marine diesel), leakage of refrigerant gases (HFC, PFC) and leakage of SF6 gas. Scope 2 Emissions comprise the indirect emissions of the organization, being those deriving from its direct consumption excluding generation activities. These include: purchased electricity, district heating and steam. With regard to Scope 2 emissions, Market-based is a method of quantification based on the CO₂ emissions of the energy suppliers from which the business purchases, under contract, an electricity supply. The figure does not include Encore Wire emissions as the company is waiting for approval of the 2019 baseline restatement by SBTi.
(1) Scope 1 Emissions comprise the direct emissions of the organization, being those generated from resources under its direct control. The reported Scope 1 emissions refer to combustion processes (using natural gas, LPG, petrol, diesel, fuel oil, marine diesel), leakage of refrigerant gases (HFC, PFC) and leakage of SF6 gas. Scope 2 Emissions comprise the indirect emissions of the organization, being those deriving from its direct consumption excluding generation activities. These include: purchased electricity, district heating and steam. With regard to Scope 2 emissions, Market-based is a method of quantification based on the CO₂ emissions of the energy suppliers from which the business purchases, under contract, an electricity supply. The figure does not include Encore Wire emissions as the company is waiting for approval of the 2019 baseline restatement by SBTi.
Metrics
Targets related to climate change mitigation and adaptation (34. a, 34. b)
| Total 2024 former Prysmian perimeter | Total 2024 Prysmian | Target 2030 | Target 2035 | Target 2050 | |
|---|---|---|---|---|---|
| GHG emission reduction Scope 1 | |||||
| Absolute value of GHG emissions tCO₂e | 217,306 | 227,215 | - | - | - |
| Percentage reduction of GHG emission | -44% | - | - | - | - |
| Intensity reduction of GHG emission tCO₂e | 0.001% | - | - | - | - |
| GHG emission reduction Scope 2 - Location Based | |||||
| Absolute value of GHG emissions tCO₂e | 447,153 | 474,155 | - | - | - |
| Percentage reduction of GHG emission | -23% | - | - | - | - |
| Intensity reduction of GHG emission tCO₂e | 0.003% | - | - | - | - |
| GHG emission reduction Scope 2 - Market Based | |||||
| Absolute value of GHG emissions tCO₂e | 365,091 | 393,573 | 414,229 | 92,051 | 92,051 |
| Percentage reduction of GHG emission | -32% | - | -55% | -90% | -90% |
| Intensity reduction of GHG emission tCO₂e | 0.000% | - | - | - | - |
| GHG emission reduction Scope 3 | |||||
| Total Gross indirect (Scope 3) GHG emissions - Absolute value of GHG emissions | 235,598,561 | 239,303,832 | 213,978,518 | - | 29,719,239 |
| Percentage reduction of GHG emission | -21% | -28% | - | -90% | |
| Intensity reduction of GHG emission | 1.38% | - | - | - | - |
| 1: Purchased goods and services - Absolute value of GHG emissions | 11,115,382 | 11,747,429 | - | - | - |
| Percentage reduction of GHG emission | -0.2% | - | - | - | - |
| Intensity reduction of GHG emission | 0.07% | - | - | - | - |
| 2: Capital goods - absolute value | 315,735 | 324,258 | - | - | - |
| Percentage reduction of GHG emission | 153% | - | - | - | - |
| Intensity reduction of GHG emission | 0.002% | - | - | - | - |
| 3: Fuel and energy-related activities (not included in Scope 1 or Scope 2) - Absolute value of GHG emissions | 187,793 | 199,625 | - | - | - |
| Percentage reduction of GHG emission | 11% | - | - | - | - |
| Intensity reduction of GHG emission | 0.001% | - | - | - | - |
| 4: Upstream transportation and distribution - Absolute value of GHG emissions | 424,491 | 443,212 | - | - | - |
| Percentage reduction of GHG emission | -8% | - | - | - | - |
| Intensity reduction of GHG emission | 0.002% | - | - | - | |
| 5: Waste generated in operations - Absolute value of GHG emissions | 120,092 | 121,523 | - | - | - |
| Percentage reduction of GHG emission | 105% | - | - | - | |
| Intensity reduction of GHG emission | 0.001% | - | - | - | |
| 6: Business traveling - Absolute value of GHG emissions | 23,102 | 23,124 | - | - | - |
| Percentage reduction of GHG emission | 368% | - | - | - | |
| Intensity reduction of GHG emission | 0.00% | - | - | - | |
| 7: Employee commuting - Absolute value of GHG emissions | 52,508 | 52,669 | - | - | - |
| Percentage reduction of GHG emission | 9% | - | - | - | |
| Intensity reduction of GHG emission | 0.00% | - | - | - | |
| 8: Upstream leased assets - Absolute value of GHG emissions | 660 | 660 | - | - | - |
| Percentage reduction of GHG emission | 70% | - | - | - | |
| Intensity reduction of GHG emission | 0.00% | - | - | - | |
| 9: Downstream transportation - Absolute value of GHG emissions | 23,703 | 24,075 | - | - | - |
| Percentage reduction of GHG emission | 100% | - | - | - | |
| Intensità di riduzione di GHG emission | 0.00% | - | - | - | |
| 11: Use of sold products - Absolute value of GHG emissions | 223,206,626 | 226,207,451 | - | - | - |
| Percentage reduction of GHG emission | -22% | - | - | - | |
| Intensity reduction of GHG emission | 1.31% | - | - | - | |
| 12: End-of-life treatment of sold products - Absolute value of GHG emissions | 15,508 | 46,847 | - | - | - |
| Percentage reduction of GHG emission | -68% | - | - | - | |
| Intensity reduction of GHG emission | 0.00% | - | - | - | |
| 15: Investments - Absolute value of GHG emissions | 112,960 | 112,960 | - | - | - |
| Percentage reduction of GHG emission | 67% | - | - | - | |
| Intensity reduction of GHG emission | -68% | - | - | - | |
| GHG emission reduction | |||||
| Scope 1 + Scope 2 - Location Based + Scope 3 | |||||
| Absolute value of GHG emissions tCO₂e | 236,263,020 | 240,005,202 | - | - | - |
| Percentage reduction of GHG emission | -21% | - | - | - | |
| Intensity reduction of GHG emission | 1.39% | - | - | - | |
| Scope 1 + Scope 2 - Market Based + Scope 3 | -21% | - | - | - | |
| Absolute value of GHG emissions tCO₂e | 236,180,958 | 239,924,620 | - | - | 29,816,040 |
| Percentage reduction of GHG emission | -21% | - | - | -90% | |
| Intensity reduction of GHG emission | -1.39% | - | - | - |
Pollution
| ESRS 2-4 Pollution of air, water and soil | Total 2024 |
|---|---|
| 28. (a) Emissions of pollutants into the air | - |
| NOX ton | 5,337.5 |
| 28. (a) Emissions of pollutants into the water | - |
| 28. (a) Emissions of pollutants into the soil | - |
Waste (kg)
| Resource outflows (t) E5-5c | Total 2024 | Total 2023 |
|---|---|---|
| Not disposed of | ||
| 37. (b) Total | 171,490,574 | 168,848,986 |
| 37. (b) Hazardous waste | 7,283,844 | 6,027,126 |
| 37. (b) i. Preparation for reuse | - | - |
| 37. (b) ii. Recycling | 7,283,844 | 6,027,126 |
| 37. (b) iii. Other recovery operations | - | - |
| 37. (b) Non-hazardous waste | 164,206,730 | 162,821,860 |
| 37. (b) i. Preparation for reuse | - | - |
| 37. (b) ii. Recycling | 164,206,703 | 162,821,860 |
| 37. (b) iii. Other recovery operations | 27 | - |
| Intended for disposal | ||
| 37. (c) Total | 69,863,077 | 66,314,855 |
| 37. (c) Hazardous waste | 6,889,484 | 6,353,919 |
| 37. (c) i. Incineration | 3,141,623 | 2,852,812 |
| 37. (c) ii. Landfill | 1,433,621 | 1,740,750 |
| 37. (c) iii. Other recovery operations | 2,314,240 | 1,760,357 |
| 37. (c) Non-hazardous waste | 62,967,007 | 59,960,936 |
| 37. (c) i. Incineration | 13,252,419 | 13,030,721 |
| 37. (c) ii. Landfill | 43,969,659 | 41,793,434 |
| 37. (c) iii. Other recovery operations | 5,744,929 | 5,136,781 |
| 37. (d) Non-recycled waste | 69,848,417 | 66,314,855 |
| 37. (d) Percentage of non-recycled waste | 28.94% | 28.20% |
| 37. (a) Total waste | 241,347,065 | 235,163,841 |
Water used (m3) by source
| Water used (m3) by source | Total 2024 | Total 2023 |
|---|---|---|
| 28. (a) Total water consumption | 6,705,486 | 7,040,079 |
| 28. (b) Total water consumption in areas at water risk, including high water stress areas | 1,723,497 | 1,954,995 |
| 28. (c) Total recycled and reused water | 5,163,225 | 6,350,855 |
| 28. (d) Total volume of stored water | - | - |
| 28. (e) Percentage of amounts obtained from direct measurements, extrapolations, sampling, or the best possible estimate | 93% | 93% |
| 29. The company provides information on its water intensity: total water consumption in its operations in m3 per million Euro of net revenue | 39 | 45 |
People
People, Prysmian's human capital
Prysmian places people at the center of its activities. This commitment is reflected both in employee initiatives (e.g., promoting work-life balance, diversity, inclusion, training) and in supporting the social communities in which the company operates.
Topics
SDG's
Goals: 2023-2025 Prysmian Scorecard

| S1-Own Operations | Percentage of women employees hired1 | 44.9% | 46% | 47.5% | 46%/48% |
| Percentage of women executives2 | 15.7% | 18.8% | 19.2% | 20%/23% | ||
|
| S1-Own Operations | Safety Assessment Plan3 | - | 3.4 | 4.01 | 2.75/5 |
| Leadership Impact Index4 | 55% | 57% | N/A | 57%/61% |
1 Share of women desk workers hired with permanent contract compared to the total employees hired with permanent contract. The index includes all desk workers hired from External (including global recruiting programs and projects) and all change of contracts from agency/temporary to permanent The figure for the Prysmian scope alone in 2024, excluding Encore Wire, is 47.7%.
2 Share of women in executive positions (job grade 20 and above) as a percentage of total executive employees. The KPI reflects the ability of the Group to develop internal figures to take on leadership roles, its capability to hire them from the market and its ability to retain those talents. The target to 2025 has been modified compared to previous financial statements as a result of the change in scope due to the integration of Encore Wire. More information will be published by 16 March 2025 in the 2025 Report on remuneration policy and compensation paid. The figure for the Prysmian scope alone in 2024, excluding Encore Wire, is 20.1%.
3 Index relating to the level of maturity in the safety management of the Group's various plants, calculated following an Audit conducted by a specialized third-party company. The index consists of four different categories (governance, employee engagement, risk assessment and injury frequency rate). At the end of the assessment, an overall score is given on a scale of 1 (lowest) to 5 (highest). The figure refers only to Prysmian alone, as it is not applicable to Encore Wire for the year 2024.
4 Index calculated as the percentage of employees who declared a level of engagement with the company of at least 5 out of 7 points in the Speak Up survey conducted by the company. The indices and the survey were developed in collaboration with POLIMI University in order to ensure their quality and anonymity. In 2024, the Speak up survey was not conducted in the face of the Encore Wire integration process that took place starting in the second half of the year. The survey will be sent to employees in 2025.
2024 Performance
Number of employees by gender and by contract type
| Men | Women | Other | Not disclosed | Total | |
|---|---|---|---|---|---|
| Total employees | 25,785 | 6,751 | 7 | 3 | 32,546 |
| Permanent employees | 25,210 | 6,637 | 7 | 3 | 31,857 |
| Temporary employees | 575 | 114 | - | - | 689 |
| Non-guaranteed hours employees | - | - | - | - | - |
Diversity metrics (66. b) - employees by age group
| ≤30 years old | 30-50 years old | ≥50 years old | Total 2024 | |
|---|---|---|---|---|
| Number | ||||
| Executives | - | 211 | 238 | 449 |
| Managers | 169 | 1,941 | 1,076 | 3,186 |
| Employees | 1,029 | 2,661 | 1,408 | 5,098 |
| Workers | 4,399 | 12,405 | 7,009 | 23,813 |
| Total | 5,597 | 17,218 | 9,731 | 32,546 |
| Percentage | ||||
| Executives | 0.0% | 0.6% | 0.7% | 1.4% |
| Managers | 0.5% | 6.0% | 3.3% | 10% |
| Employees | 3.16% | 8.18% | 4.33% | 16% |
| Workers | 13.5% | 38.12% | 21.54% | 73% |
| Total | 17% | 53% | 30% | 100% |
Work-Life Balance Metrics
| Work-life balance metrics | Women | Men | Other | Not disclosed | Total 2024 |
|---|---|---|---|---|---|
| 94. If all of the undertaking’s employees are entitled to family-related leave through social policy and/or collective bargaining agreements, it is sufficient to disclose this in order to meet the requirement of paragraph 93a. | |||||
| Number of employees who can take family leave: | |||||
| maternity, paternity, parental leave | 6,751 | 25,785 | 7 | 3 | 32,546 |
| caregiver leave | 4,964 | 21,365 | 7 | 3 | 26,339 |
| Number of employees who have taken family leave: | |||||
| maternity, paternity, parental leave | 393 | 841 | - | - | 1,234 |
| caregiver leave | 119 | 430 | - | - | 549 |
| 93. (a) Percentage of employees entitled to take family-related leave | |||||
| maternity, paternity, parental leave | 100% | 100% | 100% | 100% | 100% |
| caregiver leave | 73.5% | 82.9% | 100% | 100% | 80.9% |
| 93. (b) Percentage of entitled employees that took family-related leave | |||||
| maternity, paternity, parental leave | 5.8% | 3.3% | - | - | 3.8% |
| caregiver leave | 2,4% | 2,0% | - | - | 2,1% |
| Comments | All Prysmian employees are entitled to a minimum of days of maternity, paternity and parental leave according to the Global Parental Policy. As regards carers' leave, Prysmian applies local legislation. | ||||
Incidents, Complaints and Serious Human Rights Impacts
| Incidents, complaints and severe human rights impacts | Total 2024 |
|---|---|
| 103. (a) Number of work-relatd incidents of discrimination reported in the reporting period | |
| Gender | 2 |
| Racial or ethnic origin | 3 |
| Nationality | - |
| Disability | 2 |
| Age | 1 |
| Sexual orientation | - |
| Harassment | 4 |
| Other relevant forms of discrimination | 11 |
| Total | 24 |
| 103. (b) Number of complaints filed through channels for people in the undertaking’s own workforce to raise concerns (including grievance mechanisms) | 174 |
| 103. (b) where applicable, to the National Contact Points for OECD Multinational Enterprises related to the matters defined in paragraph 2 of this Standard, excluding those already reported in (a) above; | n.a |
| 103. (c) Total amount of fines, penalties, and compensation for damages as a result of the incidents and complaints | - |
| 103. (c) Provide a reconciliation of such monetary amounts disclosed with the most relevant amount presented in the financial statements; and | n.a |
| ""103. (d) Where applicable, contextual information necessary to understand the data and how such data has been compiled. | n.a |
| 104. (a) Number of severe human rights incidents connected to the undertaking’s workforce in the reporting period: | |
| Cases of non-respect of the UN Guiding Principles on Business and Human Rights | - |
| Cases of non-respect of ILO Declaration on Fundamental Principles and Rights at Work | - |
| Cases of non-respect of OECD Guidelines for Multinational Enterprises | - |
| Total | |
| 104. (a) If no severe human rights incidents connected to the undertaking’s workforce have occurred, the undertaking shall state this. | No severe cases of H.R. incidents in the FY 24 |
| 104. (b) Total amount of fines, penalties and compensation for damages for the incidents described. | - |
| 104. (b) Provide a reconciliation of the monetary amounts disclosed in the most relevant amount in the financial statements. | n.a |
| Comments |
ESRS S1-14 Health and Safety Metrics
| ESRS S1-14 Health and safety metrics | Employees | Non-employee workers | Total 2024 |
|---|---|---|---|
| 88. (a) Percentage of people in its own workforce who are covered by the undertaking’s health and safety management system based on legal requirements and/or recognised standards or guidelines | 82% | 91% | 83% |
| 88. (b) Number of fatalities as a result of work-related injuries | - | - | - |
| 88. (b) Number of fatalities as a result of work-related injuries work-related ill health | 23 | - | - |
| 88. (c) Number of recordable work-related accidents (LTI, RWC, MT)1 | 556 | 55 | 611 |
| Hours worked | 58,874,497 | 3,946,656 | 62,821,153 |
| 88. (c) Rate of recordable work-related accidents | 9 | 14 | 10 |
| Employees | Non-employee workers | Total 2024 | |
| 88. (d) Disclose the number of cases of recordable work-related ill health, subject to legal restrictions on the collection of data | - | - | - |
| 88. (e) Number of days lost to work-related injuries and fatalities from work-related accidents, work-related ill health and fatalities from ill health | 17,441 | 950 | 18,391 |
Diversity metrics (66. a, AR. 71) - gender distribution at top management levels
| Total 2024 | % | |||
|---|---|---|---|---|
| Women | 7 | 16% | ||
| Men | 38 | 84% | ||
| Other | - | - | ||
| Not disclosed | - | - | ||
| Total Top Management | 45 | 100% | ||
| AR 71. Disclose the definition of top management used | Grade 24 and above (Korn-Ferry Hay methodology) | |||
People with disabilities
| Total 2024 | ||||
|---|---|---|---|---|
| Persons with disabilities | Number | Percentage | ||
| 79. Persons with disabilities amongst its employees, subject to legal restrictions on the collection of data | 697 | 2.14% | ||
Training and skills development metrics (83.a)
| Total 2024 | |||||
|---|---|---|---|---|---|
| Training and skills development metrics (83. a) | Number of employees that participated in regular reviews | Number of regular reviews | Number of employees | Percentage of employees that participated in regular reviews | Number of regular reviews conducted per employee |
| Woman | 2,629 | 2,629 | 6,751 | 38.94% | 1 |
| Man | 4,947 | 4,947 | 25,785 | 19.2% | 1 |
| Other | 2 | 2 | 7 | 28.6% | 1 |
| Not disclosed | 1 | 1 | 3 | 33.3% | 1 |
| Total | 7,579 | 7,579 | 32,546 | 23.3% | 1 |
Training and skills development metrics
| Total 2024 | Number of training hours | Aveage hours of training |
|---|---|---|
| Woman | 273,423 | 43 |
| Man | 934,429 | 38 |
| Other | 241 | 25 |
| Not disclosed | 91 | 46 |
| Total | 1,208,184 | 39 |
Sustainable Value
Prysmian operates in a highly competitive and dynamic environment. To maintain and strengthen its market position, it is critical for the company to consider the entire ecosystem of its value chain.
Understanding the needs and challenges of all stakeholders enables Prysmian to optimize its processes, reduce costs and improve the resilience of the entire chain. In addition, collaboration and transparency with partners along the value chain are crucial to developing innovative solutions, anticipating market changes, and responding promptly to technological and regulatory changes. This approach not only promotes more efficient resource management, but also ensures better alignment between the different stages of the production and distribution process, contributing to greater sustainability and innovation and creating shared value for all parties concerned.
Topics
SDG's
Goals: 2023-2025 Prysmian Scorecard
|
| E5-Circular Economy | Share of revenues from sustainable products 5 | 30% | 27% | 43.1% | 40% |
| Portion of recycled content on PE jackets and copper6 | 10% | 12.8% | 16.2% | 14.5%/15.7% | ||
|
| S3-Affected communites | Provide households with access to sustainable electricity1 | 21m | 56m | 78.4m | 110m |
| Providing families with rapid digital access2 | 3m | 9m | 17.1m | 15m |
1 Percentage of total revenues coming from the sale of environmentally friendly products.
2 Percentage by weight of recycled content of certain purchased materials. The scope of the indicator includes 1) copper purchased at Group level, excluding occasional suppliers and semi-finished products; 2) polyethylene used for sheathing, excluding those applications for which customers do not allow the use of secondary materials. The target to 2025 has been modified compared to previous financial statements as a result of the change in scope due to the integration of Encore Wire. More information will be published by 16 March 2025 in the 2025 Report on remuneration policy and compensation paid. The figure for the Prysmian scope alone in 2024, excluding Encore Wire, is 16%.
3 Estimated households connected to green energy through Prysmian products. It includes installed capacity through photovoltaic panels, onshore and offshore wind turbines, and interconnections intended for renewable energy generation.
4 Estimated connected households with fast digital access (defined as FTTH, FTTB, DOCSIS 4) thanks to Prysmian products.
Performance 2024
In order to monitor the actions put into place and the achievement of policy objectives, the Group constantly analyzes the following performance metrics relating to potential impacts and risks identified throughout the value chain.
| KPI | UNIT OF MEASUREMENT | 2024 | 2023 |
|---|---|---|---|
| Total number of suppliers included in Desk & Risk Analysis | Number | 500 | 500 |
| Number of sustainability audits in the supply chain | Total number since start of initiative | 44 | 36 |
Material used by weight or volume [kTon]
| Resource inflows | Total weight | 31. (a) Of which technical materials | Of which biological materials | 31. (c) Of which reused or recycled components | Total weight | 31. (a) Total weight | Of which from certified sustainable sources | 31. (b) Percentage | Total weight | Percentage |
|---|---|---|---|---|---|---|---|
| Metals | 1,267.10 | 1,267.10 | - | - | 64.40% | 102.6 | 8.02% |
| Compounds | 359.40 | 359.40 | - | - | 18.26% | - | - |
| Ingredients | 304.70 | 304.70 | - | - | 15.48% | - | - |
| Chemicals | 5.20 | 5.20 | - | - | 0.26% | - | - |
| Other (paper. yarns. tapes. oil) | 31.50 | 31.50 | - | - | 1.60% | - | - |
| Total non-renewable materials | 1,967.90 | 1,967.90 | - | - | - | - | |
| Total | 1,967.90 | 1,967.90 | - | - | 100% | - | 0 |
(*) Compounds: in the processing of rubber, mixtures of polymers and ingredients (talc, kaolin, carbon, etc.) having various functions (e.g. strengtheners, accelerants, colorants).
Donations - Type of donation
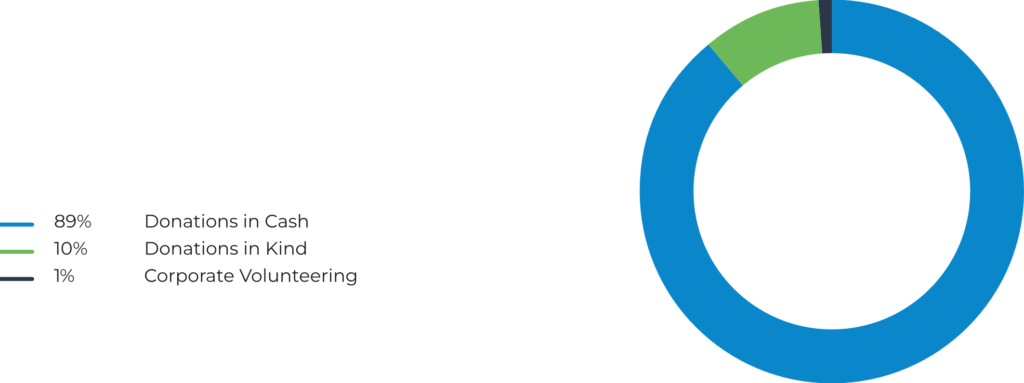
In 2019, the Group adopted a policy on Donations to identify all meritorious activities. It was revised and updated in November 2023. These donations are aimed at meeting the needs of communities or the general public, in line with the Vision, Mission, Values, Code of Ethics and Policies put in place by the Group. The Donations Policy defines the main types of contributions that can be made, the guiding principles and operating methods, and the monitoring and reporting of these activities. In 2024, approximately Euro 1.3 million was donated to support local communities through contributions in cash, products and employee hours according to the details provided below.
Donations - Type of donation
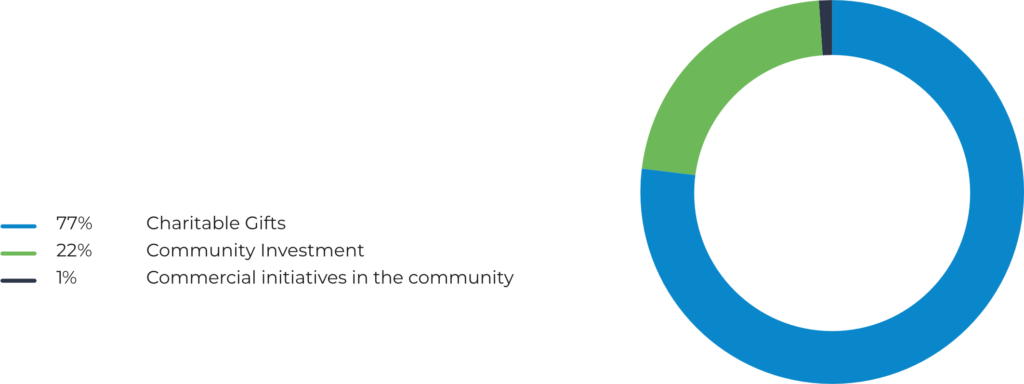
Donations - Type of initiative
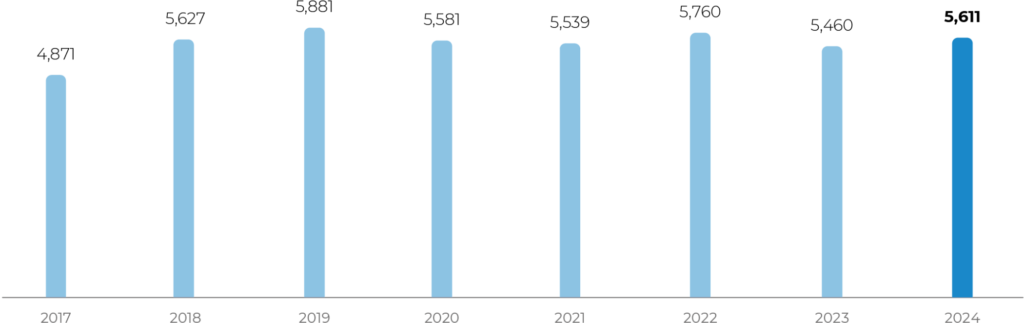
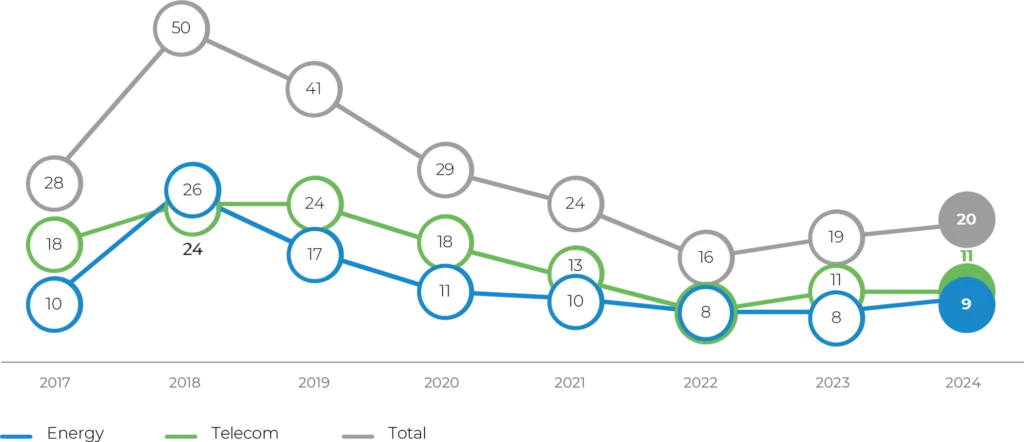
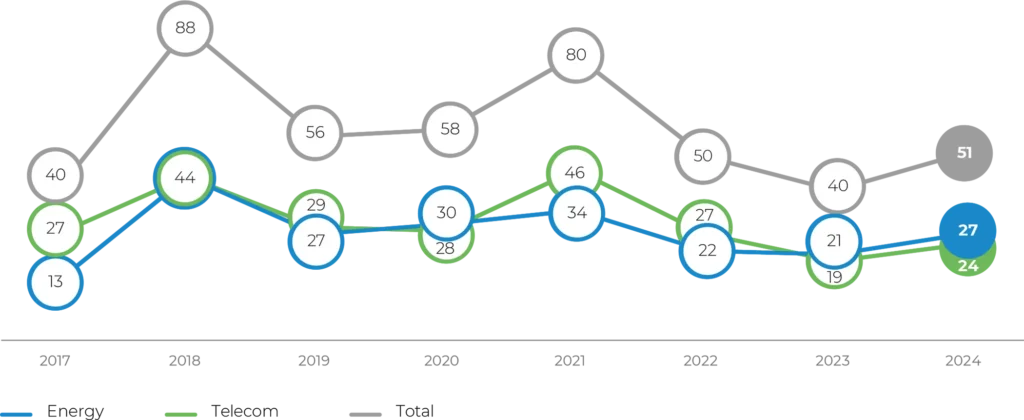
Number of patents and patent applications
| Number | |
|---|---|
| Number of patents and patent applications | 5,611 |
| Number of patents | 758 |
| New first-time filings | 20 |
| Number of ROI (records of invention) | 51 |
Number of patents and patent applications
New first filings
Number of ROI
Adding {{itemName}} to cart
Added {{itemName}} to cart
Loading...